• »
  • »

Control Room Dashboard: A Comprehensive Guide to Data Visualization

28.08.2026
A control room dashboard brings operational data, KPIs, alerts, maps, live feeds, and system status into a clear visual environment. This guide explains how dashboards work with video walls, operator workstations, and video wall management software, and how organizations can build effective data visualization for NOCs, SOCs, EOCs, command centers, and other mission-critical operations.

Dashboards have become a core part of modern control room operations. NOCs, SOCs, EOCs, command centers, and monitoring facilities now rely on multiple visualization systems to track infrastructure, security, operations, and business processes in real time.

Modern teams work with live data from monitoring platforms, analytics systems, CCTV feeds, IoT devices, SCADA platforms, and enterprise applications. Operators, analysts, supervisors, and decision-makers need to process this information quickly and coordinate actions without delays.

A control room dashboard or video wall dashboard helps transform raw operational data into actionable insights. It combines KPIs, alerts, live feeds, analytics tools, and system status into a unified operational view.

Over the last few years, control rooms have shifted from traditional process monitoring to data-driven operations. As the number of connected systems grows, organizations increasingly depend on interactive SOC dashboards, NOC dashboards, and EOC dashboards to maintain situational awareness and respond faster. NOC dashboard software, SIEM platforms, and BI tools produce these views, while control room software decides how they work together on the video wall.

Why Data Visualization Is Critical in Control Rooms

Control rooms operate under time pressure. Operators need to understand what is happening across infrastructure, security systems, industrial processes, cameras, IoT devices, and business applications without switching between dozens of disconnected interfaces.

Dashboards help turn this data into an operational picture. In NOCs, SOCs, EOCs, KPI rooms, and command centers, they show live metrics, alerts, maps, incident queues, system health, and performance indicators.

Good data visualization helps teams:

  • detect incidents faster;
  • prioritize critical events;
  • maintain situational awareness;
  • coordinate response across roles;
  • reduce decision and response time.

The risk is not a lack of data, but poor organization. If dashboards are overloaded, unreadable from the video wall distance, or scattered across separate systems, operators may miss alerts or waste time finding the right source.

Effective visualization is therefore not just about displaying information. It is about arranging dashboards, live feeds, KPIs, and alerts in a way that helps teams understand the situation and act quickly.

What Is a Control Room Dashboard?

A control room dashboard is a graphical interface that presents large volumes of structured operational data in a clear, human-friendly format. It helps operators, analysts, and decision-makers understand conditions, identify anomalies, and respond in real time.

A dashboard is not the same as a display or video wall. The dashboard is the content layer — charts, KPIs, maps, alerts, feeds, tables, and widgets. A video wall is the physical surface where this content is displayed.

In modern control rooms, dashboards are among the most common sources shown on video walls and workstations. They may come from BI platforms, SCADA, VMS/CCTV analytics, network monitoring tools, enterprise systems, or cloud observability platforms.

Video Wall Layout

A video wall layout is the arrangement of dashboards and other visual sources on a video wall, including their position, size, grouping, and role within the operational workspace.

In practice:

  • dashboard = operational content source;
  • layout = how dashboards and other sources are arranged on the video wall.

A single layout may include multiple dashboards, live camera feeds, GIS maps, SCADA interfaces, incident tracking systems, documents, browser windows, and communication tools displayed together within one operational view.
In practice, the most important question is not “Can we show this dashboard on the wall?” but “How will this dashboard work together with other sources during normal monitoring and during incidents?” A good layout should help operators understand priorities immediately, not force them to search for critical information across disconnected windows.

This is why we recommend thinking in terms of operational scenarios. For daily monitoring, one layout may be enough. For incident response, security escalation, or executive reporting, the team needs a different visual structure. The dashboard is only one element. The layout defines how useful it becomes in the control room.
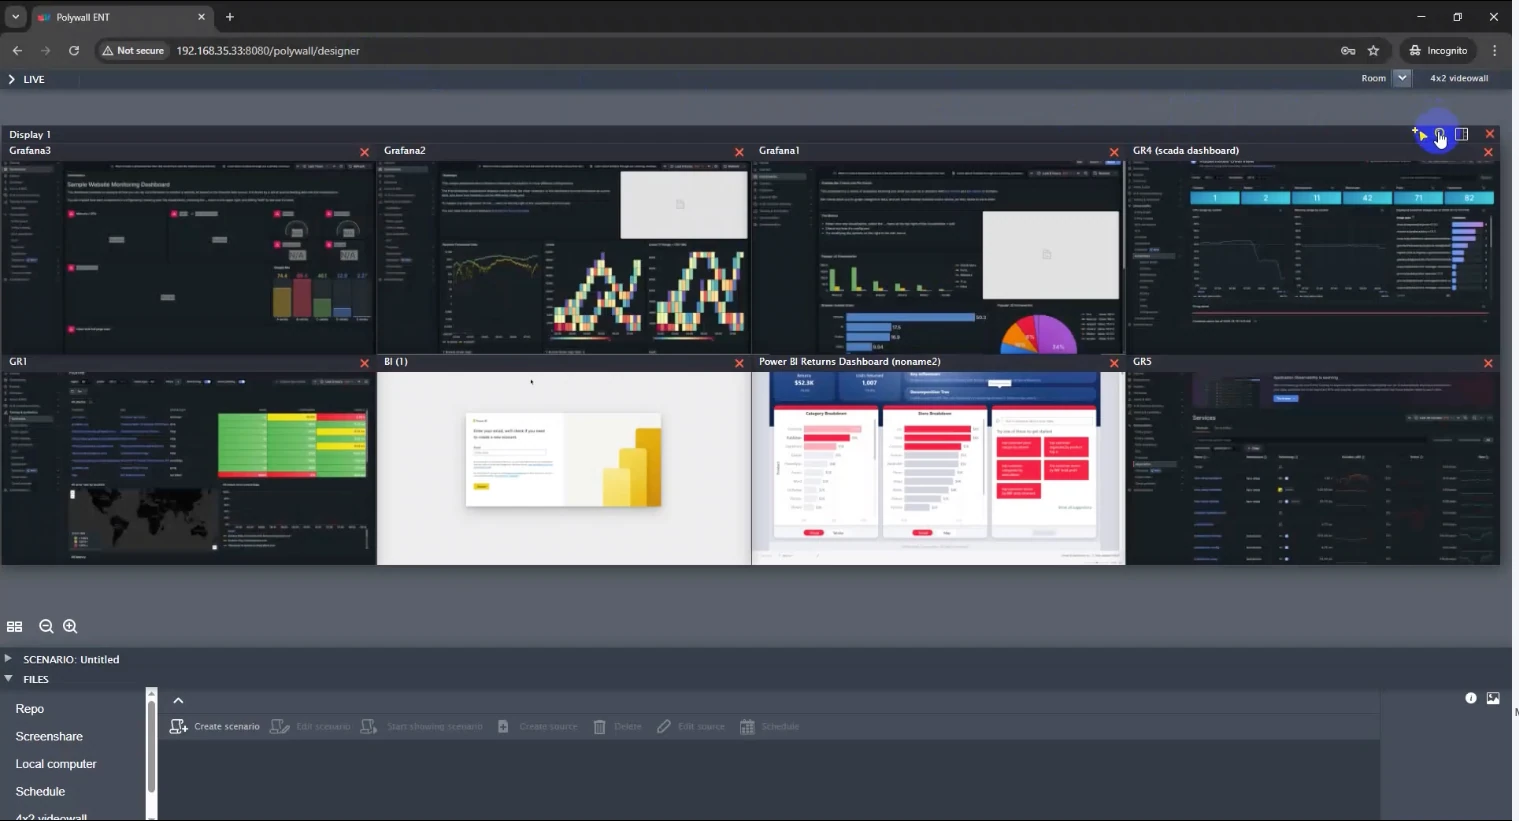
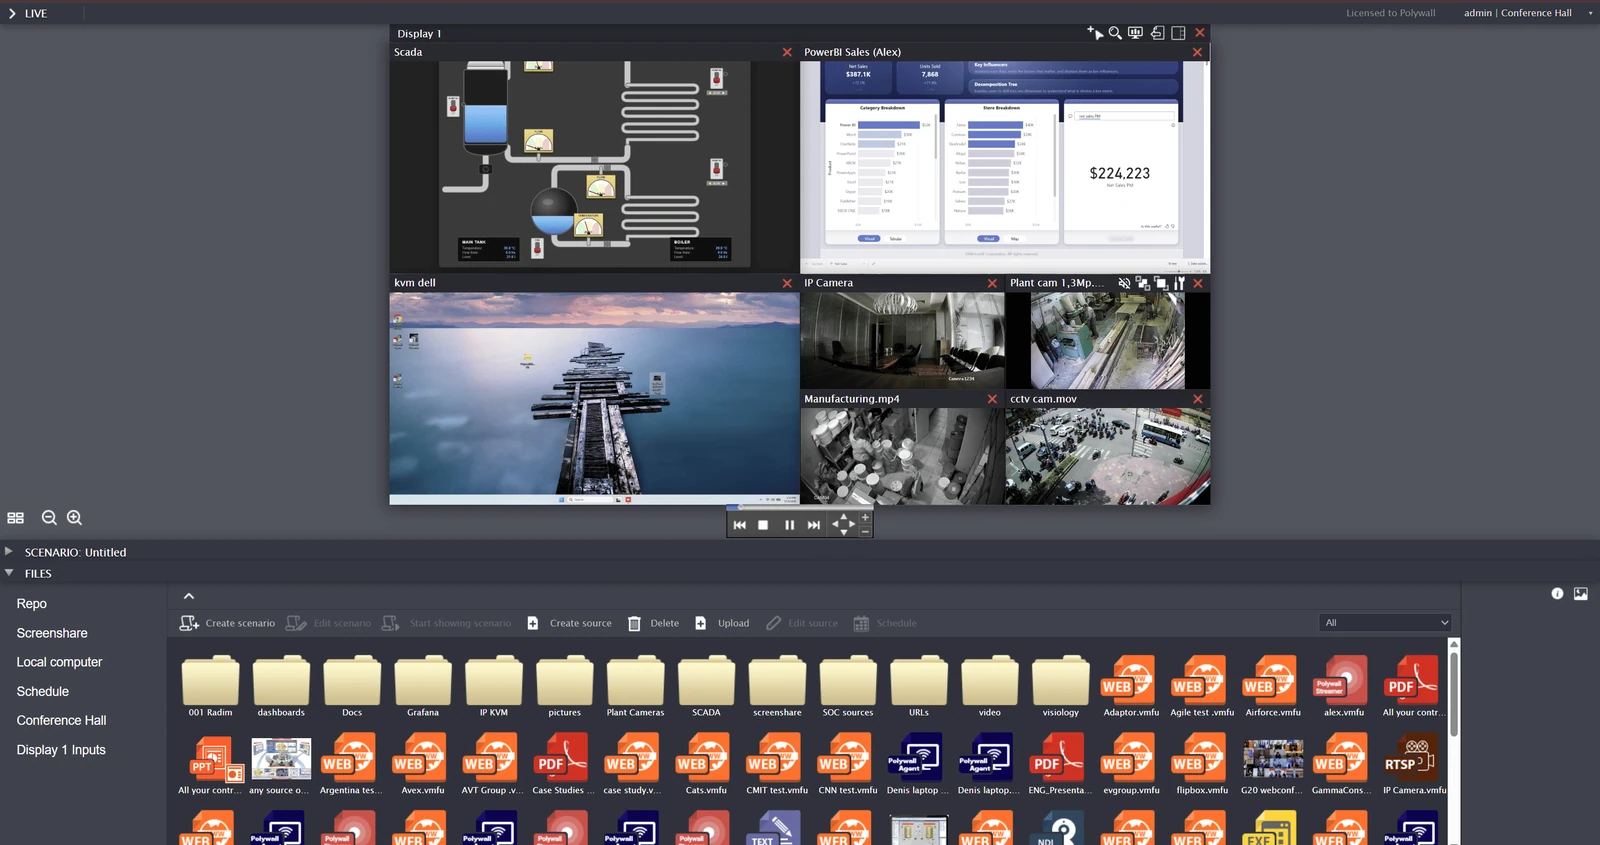
Polywall interface showing video wall layout setup with dashboards and visual sources
Example of video wall layout configuration in Polywall, where dashboards, live feeds, maps, and other sources can be arranged within one operational workspace
Modern control room dashboards usually consolidate data from:

  • BI and analytics platforms;
  • SCADA and industrial monitoring systems;
  • VMS and CCTV analytics dashboards;
  • network and infrastructure monitoring tools;
  • enterprise operational systems;
  • cloud and observability platforms.

This gives teams real-time visibility, a unified operational picture, and faster access to structured information across multiple systems.

In many ways, a dashboard works like the cockpit of an aircraft or the control panel of an industrial system. Instead of reading raw logs or switching between disconnected applications, operators work with visualized data designed for fast human perception and decision-making.

Dashboard Structure Is Changing

The structure of dashboards is also evolving. Self-service BI and AI-first analytics platforms have accelerated the shift from one complex dashboard to multiple simpler dashboards focused on specific operational tasks.

As a result, modern video walls often display several dashboards at once rather than relying on one centralized interface. Teams also increasingly prefer to access the video wall directly and interact with multiple dashboards in a shared environment instead of opening the same applications separately on local devices.

Components and Technologies Behind Control Room Data Visualization

Data visualization in a control room is not limited to showing a dashboard on a large screen. It is a visualization ecosystem where data sources, video walls, operator workstations, and management software work together.

Each layer has its own role:

  • Data sources provide live operational information.
  • Video wall management software organizes and distributes content.
  • Video walls create a shared operational overview.
  • Operator workstations support detailed analysis and interaction.
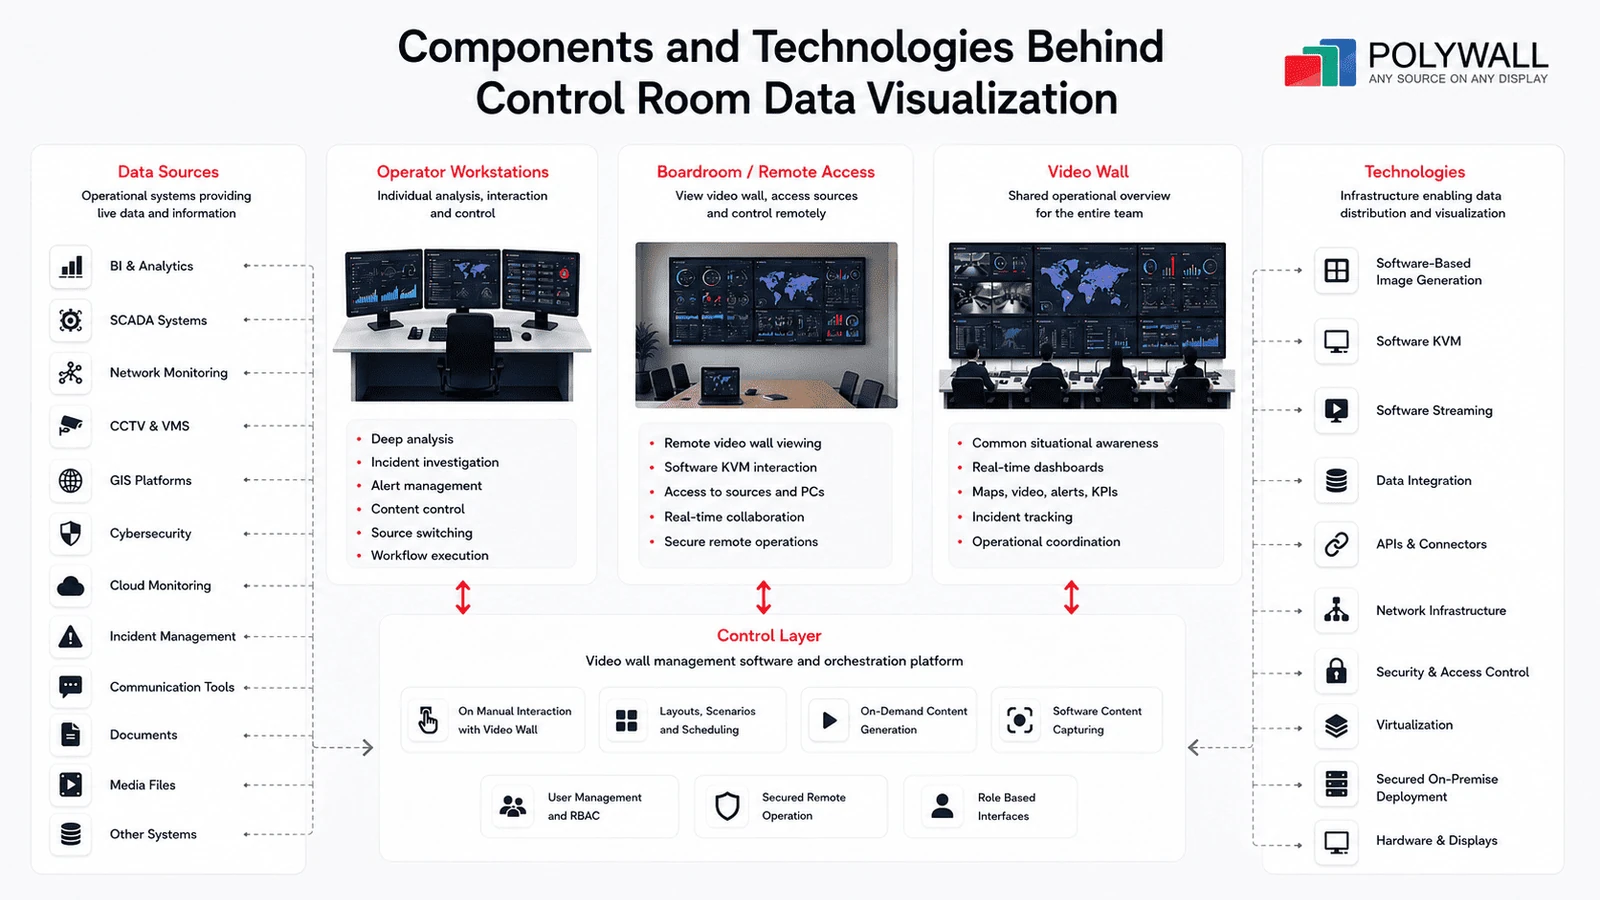
Control room data visualization architecture with data sources, video wall management software, video walls, and operator workstations
A modern control room combines data sources, video wall management software, video walls, and operator workstations into one visualization ecosystem
Video Walls: Shared Overview Layer

The video wall is the main shared visualization surface in a control room. It allows operators, supervisors, analysts, and decision-makers to see critical information at the same time.

Most control rooms use LCD or LED video walls. LCD is common in NOCs, SOCs, KPI rooms, and monitoring facilities. LED is often chosen for seamless images, high brightness, or larger display surfaces.

A video wall can show dashboards, CCTV streams, GIS maps, BI reports, SCADA screens, alerts, incident queues, and performance metrics. Its main purpose is shared situational awareness, especially during incidents.

Operator Workstations: Interaction and Control Layer

Operator workstations are used for detailed work with dashboards and operational systems. They may include one screen or multiple displays, depending on the operator’s role.

The video wall provides the overview. Workstations provide depth. Operators use them to investigate incidents, review logs, open detailed dashboards, interact with alerts, and manage workflows.

Workstations can also control what appears on the video wall. For example, a NOC operator may send a topology map to the wall, while a SOC analyst may display a SIEM dashboard or threat map for the wider team.

Control Layer: Video Wall Management Software

The control layer connects data sources, workstations, and the video wall into one manageable environment. This layer is usually provided by video wall management software or a control room orchestration platform.

It enables:

  • video wall layout control;
  • content distribution;
  • source switching;
  • dashboard positioning and resizing;
  • remote access;
  • user permissions;
  • switching between operational scenarios.

This layer is especially important when a control room uses many dashboards from different systems. It helps teams organize content logically and adapt the visual environment to current priorities.

For example, a daily monitoring layout may show KPIs, infrastructure health, and alerts. During an incident, the team can switch to a layout with CCTV feeds, GIS maps, incident dashboards, and communication tools.

Data Sources: Operational Information Systems

Modern control rooms collect data from many systems, including:

  • BI and analytics platforms;
  • SCADA systems;
  • network and IT monitoring tools;
  • CCTV and VMS systems;
  • GIS platforms;
  • cybersecurity platforms;
  • cloud and observability tools;
  • incident management systems;
  • enterprise applications.

Each control room type uses a different mix of sources. A NOC may focus on network metrics and service health. A SOC may rely on SIEM, threat intelligence, and incident queues. An EOC may combine GIS maps, emergency dashboards, weather feeds, and resource tracking.

The key point is that data is displayed both on video walls and operator screens. The video wall provides shared awareness, while workstations support detailed investigation and control. Video wall management software connects these layers and turns separate systems into a coordinated visualization environment.

Control Room Dashboards Challenges

Modern control rooms rarely work with one dashboard or one isolated system. NOCs, SOCs, EOCs, command centers, and situation rooms usually display dashboards from BI tools, SCADA, CCTV/VMS, IT monitoring, cybersecurity platforms, GIS, cloud observability tools, and enterprise systems.

The main challenge is not building dashboards, but operating many of them at scale across video walls and operator workstations. Repeated logins, unreadable interface elements, static layouts, fragmented access, and slow integration can reduce situational awareness and response speed. Use the checklist below to evaluate the main risks and the capabilities a control room dashboard solution should provide.
Challenge areaWhy it mattersWhat to look for
Access managementToo many separate systems slow down daily work and incident responseUnified access, saved states, fewer repeated logins
ReadabilityDense dashboards are hard to interpret from a distanceZoom, focus tools, readable layouts, remote interaction
Layout clarityA crowded video wall can hide priorities instead of revealing themLogical grouping, role-based views, scenario layouts
Integration modelHardware-dependent setups can make changes slow and costlySoftware-based source management and network access
Operational flexibilityControl rooms must switch between routine monitoring and critical eventsDynamic layouts and preconfigured operating modes
Team collaborationOn-site and remote users need the same operational pictureShared access, permissions, synchronized views
ScalabilityNew dashboards and systems appear as operations growFast onboarding of sources without physical reconfiguration
Below are the most common challenges and the practical ways to solve them.

1. Multi-System Access, Session Instability, and Reconfiguration Load

Control rooms use dashboards from many independent systems. A NOC may work with infrastructure monitoring and cloud services, a SOC with SIEM and threat intelligence, and an EOC with GIS maps, weather feeds, and emergency platforms.

Each system may require separate authentication. Sessions can expire, browser pages may reload, and operators may need to restore filters, time ranges, selected views, map layers, camera groups, incident queues, or dashboard states.

In a large control room, this creates time loss and can disrupt the shared video wall view during incidents.

A centralized access and visualization layer helps reduce this load. Polywall allows teams to bring dashboards and sources from different systems into one controlled environment, organize them into layouts, and restore the required visual structure faster. The goal is not to replace BI, SCADA, VMS, or monitoring tools, but to make them easier to operate together.

A good control room platform should help teams reduce repetitive logins, restore layouts quickly, maintain a stable video wall view, and simplify shift changes or incident workflows.
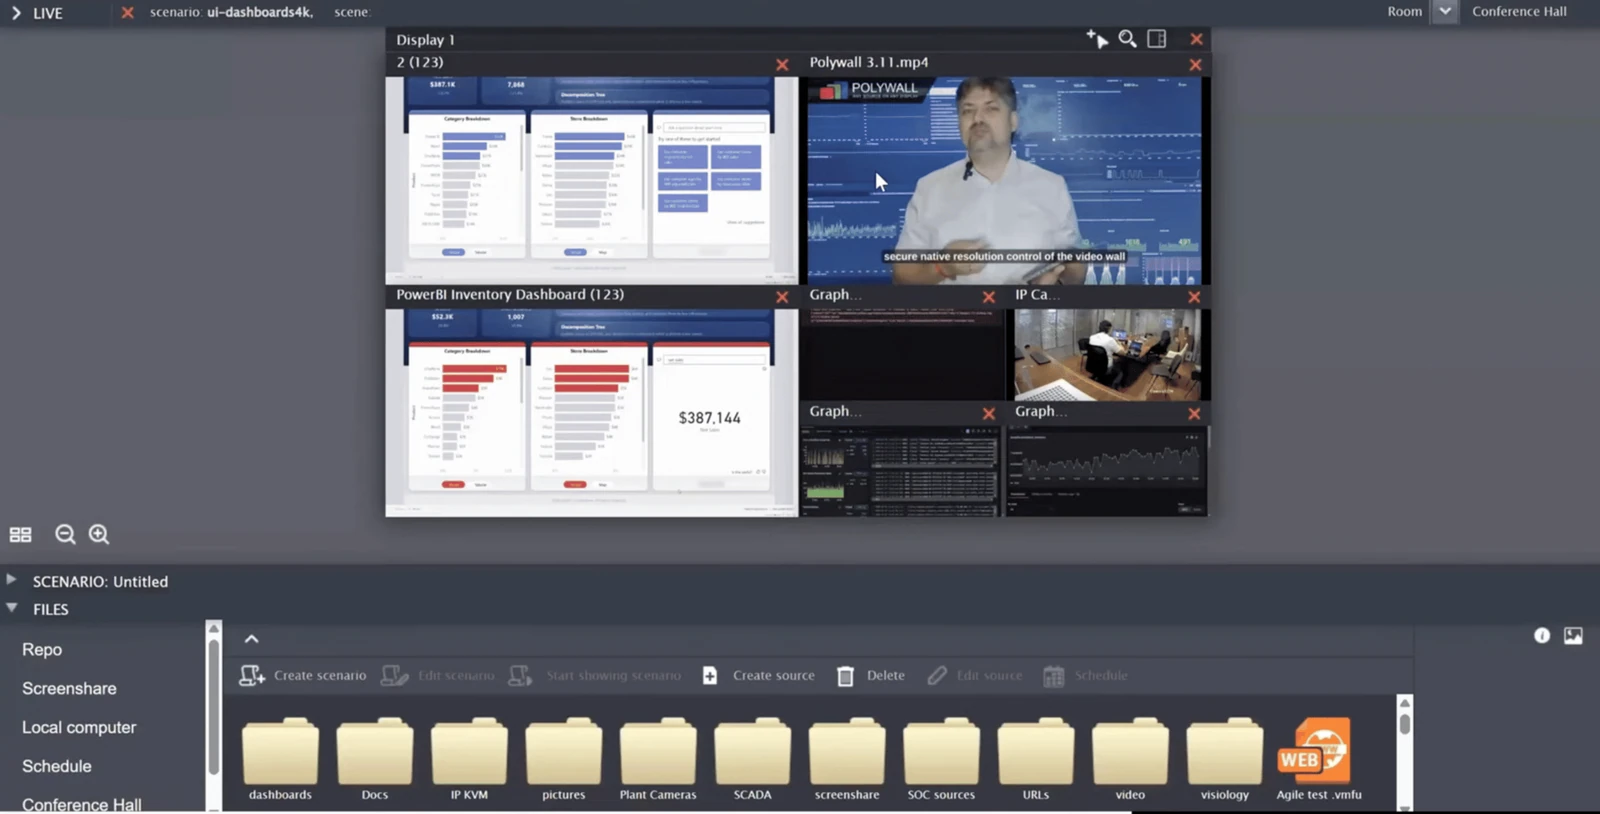
Polywall interface for managing dashboard sources and video wall layouts
Polywall helps operators manage multiple dashboard sources and restore prepared video wall layouts

2. Dashboard Readability at Video Wall Distance

Many dashboards are designed for desktop screens. They may look clear on a laptop or workstation, but become difficult to read on a large video wall viewed from several meters away.

Small text, dense tables, compact charts, alert icons, and KPI blocks can be hard to interpret. This is especially common in SOC and NOC dashboards with logs, event queues, performance graphs, and monitoring panels.

If operators cannot read a video wall dashboard quickly, it stops supporting situational awareness. Teams may need to reopen the same source locally or move closer to the wall, which slows down response.

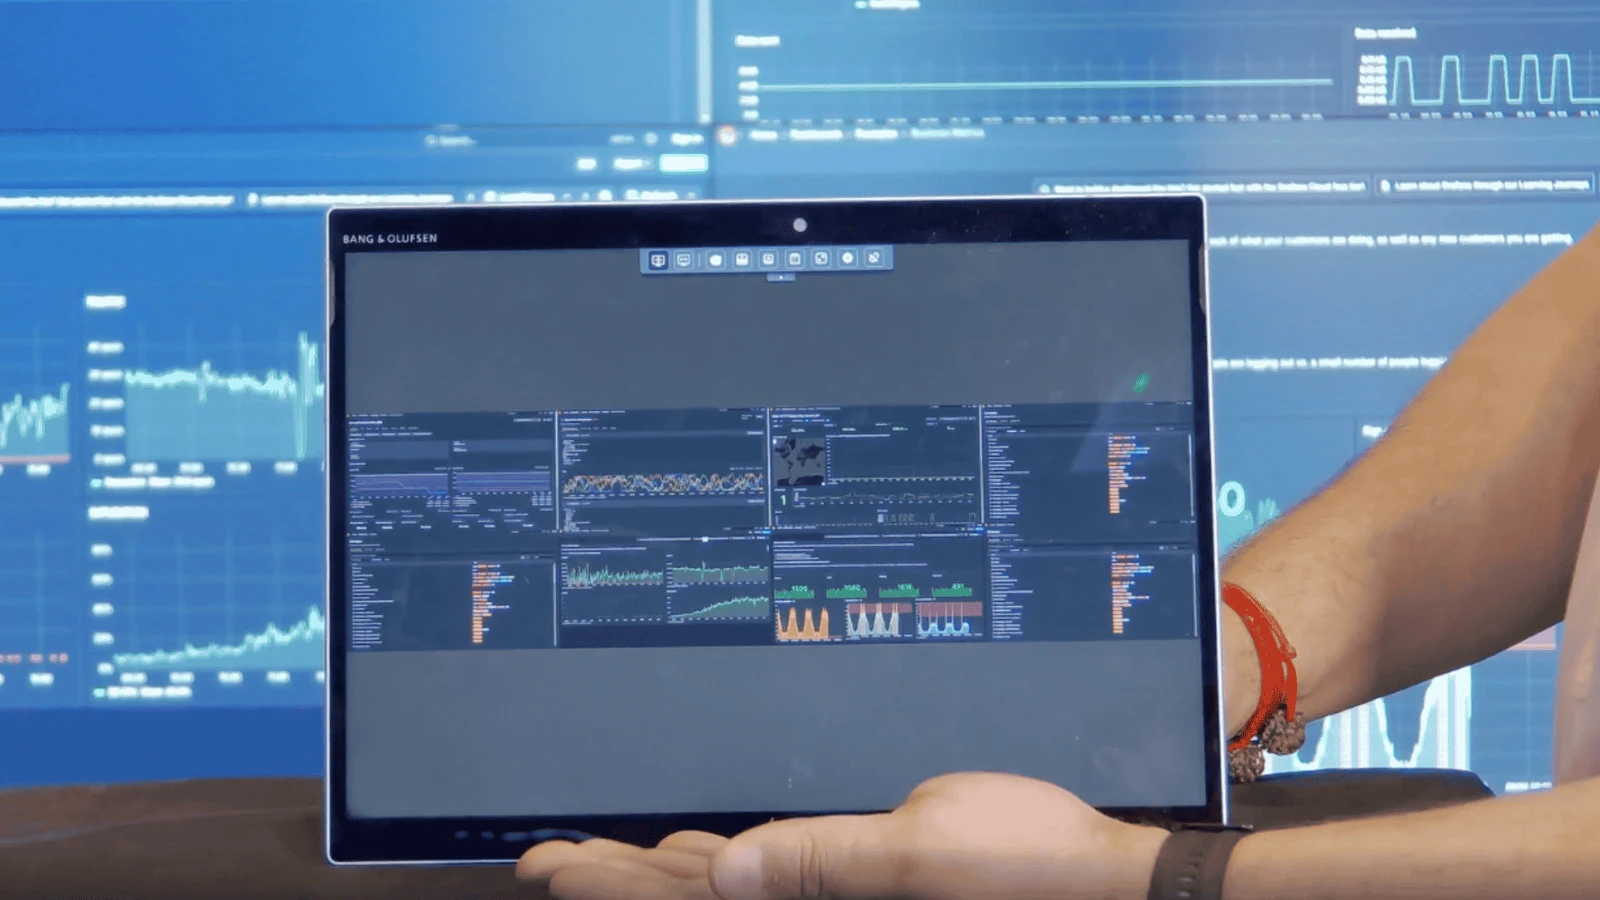
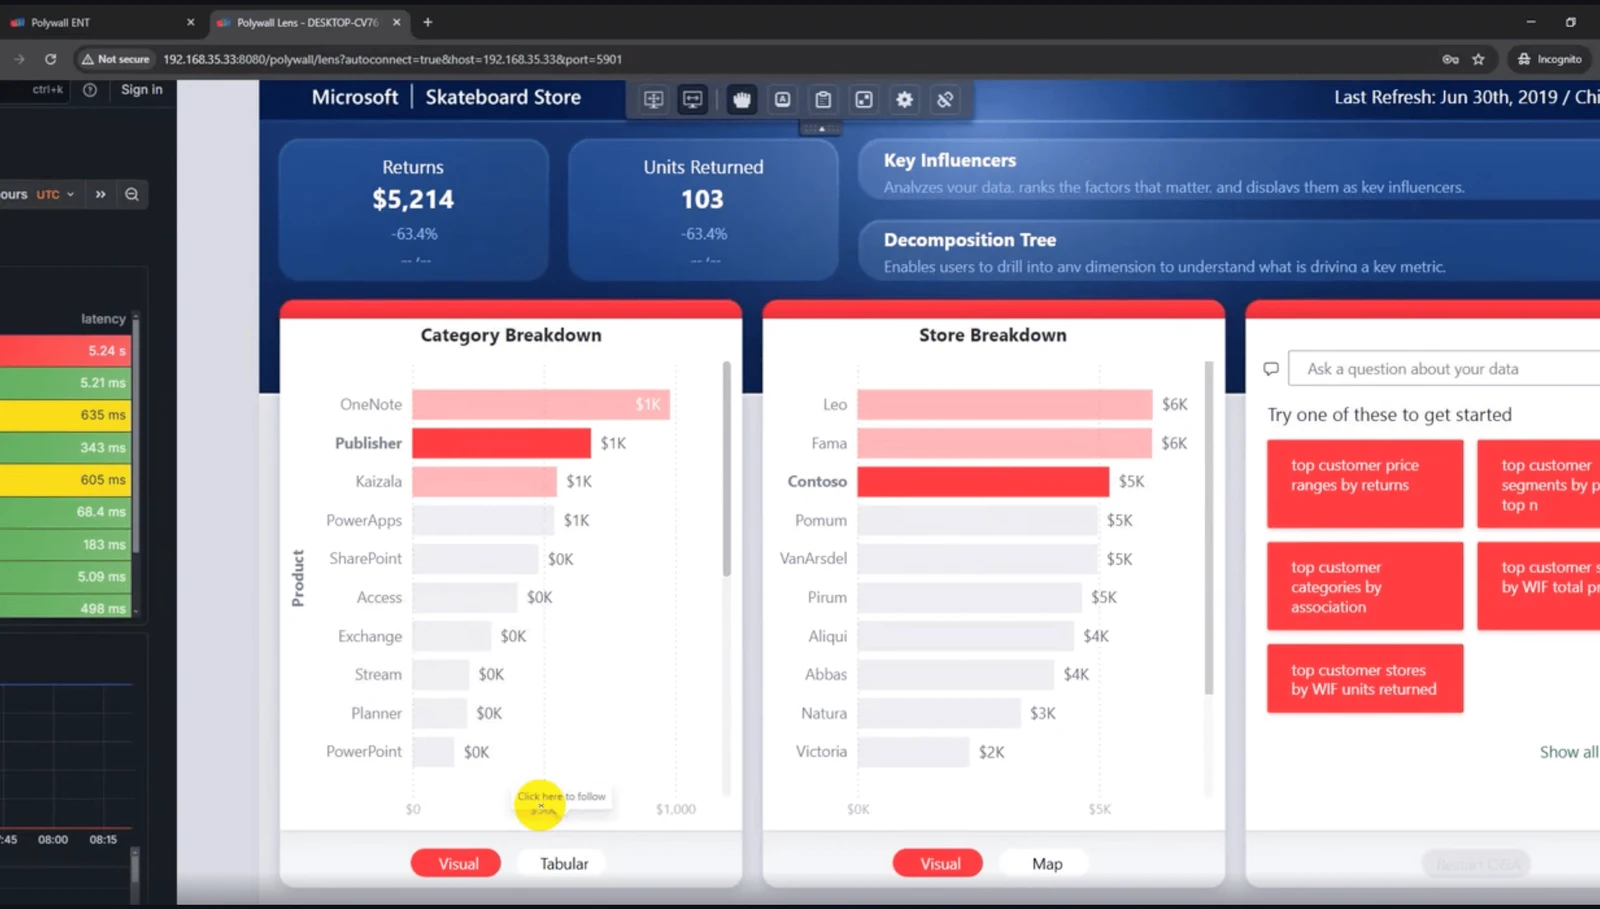
Control room software should support zoom, focus, and remote interaction with video wall content. Polywall Lens gives users browser-based access to the live video wall, allowing operators, supervisors, or remote experts to zoom into a specific chart, map area, alert panel, or remote workstation while the full layout remains visible. You can learn more about this workflow on the Polywall Lens page.
Polywall Lens showing remote access and zoom interaction with video wall dashboard content
Polywall Lens allows users to access the video wall remotely and zoom into specific dashboard areas for closer inspection

3. Multi-Dashboard Visualization Complexity

Modern control rooms often display many dashboards at the same time. The issue is not only switching between systems. The bigger problem is keeping the video wall clear and useful when many active sources compete for attention.

A NOC may display topology maps, server health, application performance, cloud infrastructure, traffic analytics, and alerts. A SOC may show SIEM dashboards, incident queues, threat maps, vulnerability metrics, and system health. An EOC may combine GIS, resource dashboards, weather data, incident status, and CCTV feeds.

If these sources are placed randomly, the wall becomes visually overloaded. Operators may struggle to understand what has priority, which dashboards relate to the same incident, and where to look first.

Teams need structured layout organization. Dashboards should be grouped by operational context, system type, domain, geography, incident priority, or user role.

For example:

  • NOC layouts can group infrastructure, applications, cloud services, and alerts.
  • SOC layouts can separate incidents, threat intelligence, system health, and analyst performance.
  • EOC layouts can combine maps, resource status, communications, and live video.
  • KPI rooms can organize financial, operational, service, and executive metrics.

Polywall supports multi-dashboard layout management, allowing teams to combine several dashboards and sources in one video wall workspace. This approach is described in more detail in our article about the Polywall multi-dashboard experience.
Polywall multi-dashboard layout showing several dashboards on a video wall
Example of a multi-dashboard video wall layout with several operational sources arranged in one workspace

4. Hardware-Based Video Wall Integration Constraints

Traditional video wall control systems often rely on hardware-based integration. New sources may require physical inputs, controller configuration, AV routing, cabling, or additional equipment.

This model can work when the source list is stable. But modern control rooms change constantly: teams add new dashboards, cloud tools, monitoring platforms, camera feeds, analytics systems, and external data sources.

The key comparison is between hardware-based video wall control systems and software-based control room platforms. Hardware-centric models can slow down source onboarding, configuration changes, system expansion, cloud integration, and adaptation to new workflows.

A software-based architecture gives teams more flexibility. Dashboards and applications can be added through network access instead of physical reconfiguration, which makes daily changes easier and reduces dependency on physical AV infrastructure.

5. Multi-Purpose Control Room Operations and Dynamic Layout Requirements

Many control rooms support more than one scenario. The same room may be used for routine monitoring, incident response, crisis coordination, executive briefings, maintenance, and special events.

Each scenario requires a different visual structure. Routine monitoring may focus on KPIs, system status, alerts, and service health. Incident response may require maps, live video, event timelines, affected systems, and communication tools. Executive reporting may need a simplified view with business impact, current status, and next steps.

Static layouts cannot support these changes effectively. If the video wall always shows the same view, operators must manually rearrange content when priorities change.

A better approach is to prepare scenario-based layouts in advance. Operators can switch between modes such as:

  • daily monitoring;
  • cybersecurity incident;
  • network outage;
  • emergency response;
  • executive briefing;
  • maintenance;
  • public event monitoring.

Polywall allows teams to create, save, edit, and recall layouts for different operational scenarios. This helps the room move from routine monitoring to incident response without rebuilding the wall manually. For a deeper look at this approach, read our article on multi-purpose control rooms.

6. Collaboration and Shared Operational Awareness

Control rooms are collaborative environments. Operators, analysts, supervisors, managers, engineers, field teams, and remote experts may all need access to the same operational picture.

If each role works with different dashboards, time ranges, or data states, incident coordination becomes slower and less consistent. Teams need shared access to video wall dashboards with role-based permissions and remote interaction.

Polywall supports this through browser-based remote access and Polywall Lens. A supervisor or expert in another location can open the live wall view, follow an incident, zoom into relevant content, and support decision-making without being physically present in the room.

This is especially useful for distributed organizations, 24/7 operations, and situations where experts must join responses remotely.
Polywall remote access to video wall dashboards from external devices
Remote users can access the live video wall view and interact with relevant dashboard content according to permissions

7. Architectural Limitations of Physical Integration Models

Hardware-centric architectures can make control rooms harder to adapt over time. When every new BI platform, monitoring tool, VMS, cloud dashboard, or external data source requires physical configuration of the video wall system, onboarding slows down.

A software-defined control room architecture helps solve this by using network-based access to dashboards and systems. Teams can add and manage dashboards, applications, camera feeds, maps, reports, and monitoring tools through software instead of redesigning the video wall infrastructure.

This supports more flexible scaling as operations grow. To understand this architecture choice in more detail, read our guide to control room hardware and software.

The main challenge is not creating dashboards, but operating them at scale. Teams need a coordinated visualization architecture that keeps multiple dashboards reliable, readable, and useful in real time.
Most organizations already have good dashboards inside their BI, SCADA, VMS, SIEM, or monitoring systems. The real challenge begins when these dashboards need to operate together on a video wall every day. Operators must deal with logins, expired sessions, unreadable details, layout changes, and the need to react quickly when something goes wrong.

From our experience, control rooms become more efficient when dashboard management is centralized and readability is treated as an operational requirement. Operators should not spend time reopening browser tabs, restoring filters, or manually arranging windows during an incident. Features such as saved layouts, zoom, focus, and remote interaction help teams return to the right operational state quickly and make decisions faster.

Types of Control Room Dashboards by Operational Environment

Control room dashboards differ by operational environment. A NOC dashboard focuses on infrastructure health, a SOC dashboard on cybersecurity alerts, and an EOC dashboard on crisis coordination, maps, resources, and public safety data.

Dashboards are rarely used alone. They are usually displayed with maps, camera feeds, documents, applications, tickers, and operational systems across video walls and operator workstations. Video wall management software helps combine these sources into structured layouts.
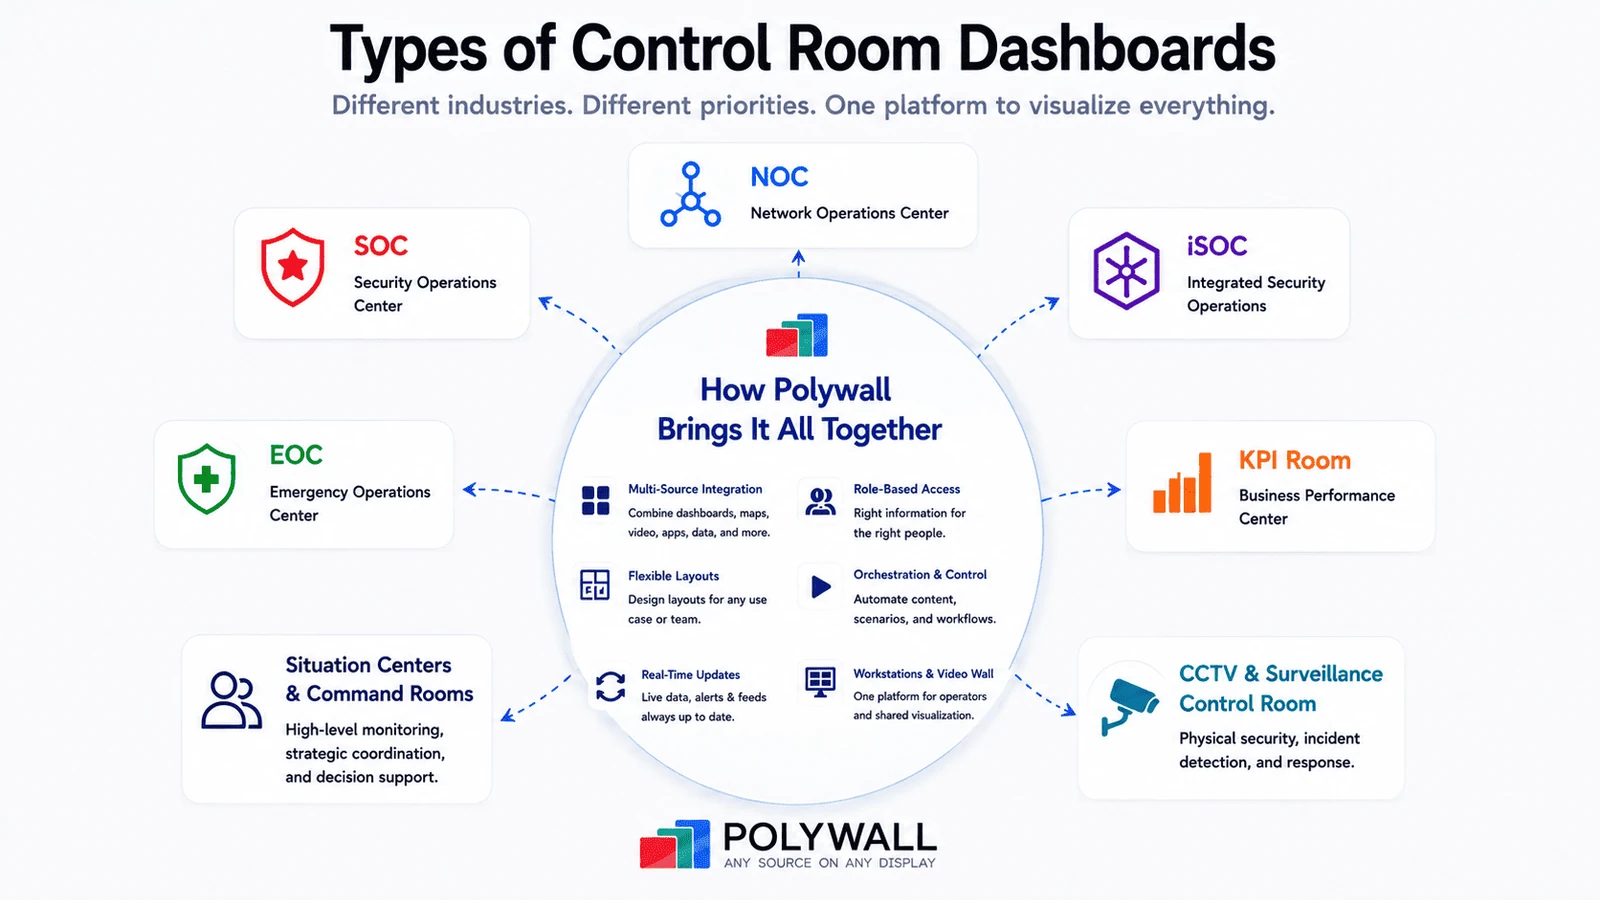
Types of control room dashboards for NOC, SOC, EOC, KPI rooms, situation centers, and surveillance control rooms
Control room typeMain purposeCommon data sourcesTypical dashboard contentMain users
NOC dashboardNetwork and IT operations monitoringNetwork monitoring tools, APM, cloud observability, server monitoring, alerting systemsNetwork topology, traffic charts, uptime, SLA metrics, infrastructure health, active alertsNOC operators, infrastructure engineers, IT managers
SOC dashboardCybersecurity monitoring and incident responseSIEM, EDR, threat intelligence, log analysis, incident management toolsSecurity alerts, incident queues, threat maps, vulnerability data, system health, MTTR and response metricsSecurity analysts, incident responders, SOC managers, CISOs
iSOC dashboardExtended cyber, physical, and business risk monitoringCybersecurity platforms, access control, CCTV/VMS, risk systems, threat intelligenceCorrelated cyber and physical events, attack surface metrics, business risk indicators, executive security viewsSenior analysts, risk teams, physical security teams, executives
EOC dashboardEmergency response and crisis coordinationGIS, emergency platforms, weather feeds, public safety systems, CCTV, agency dataIncident maps, resource status, weather alerts, live video, response progress, facility statusEmergency managers, dispatch teams, public safety officials
KPI room dashboardBusiness performance and executive monitoringBI, ERP, CRM, financial systems, production reports, data warehousesRevenue, sales metrics, operational KPIs, service indicators, executive reports, market tickersExecutives, department heads, analysts, operations managers
Situation center / command room dashboardStrategic monitoring and decision supportBI, GIS, enterprise systems, documents, communication tools, live feedsOperational dashboards, strategic KPIs, maps, reports, presentations, media feedsExecutives, crisis managers, analysts, government teams
CCTV / surveillance dashboardPhysical security and facility monitoringVMS, CCTV cameras, access control, alarm systems, perimeter monitoring, security analyticsCamera feeds, facility maps, access events, intrusion alerts, incident notificationsSecurity operators, facility managers, surveillance teams
NOC and SOC dashboards are usually highly operational: operators work with detailed alerts, metrics, queues, and event data in NOC dashboard software and security platforms, while the video wall shows the shared operational picture. EOCs, situation centers, command rooms, KPI rooms, and surveillance rooms combine dashboards with maps, live video, reports, presentations, alarms, and business metrics depending on the task.

Polywall supports these scenarios by combining dashboards, camera feeds, maps, documents, browser windows, tickers, and applications in one video wall layout for monitoring, incident response, briefings, or crisis coordination.

Data Visualization in Different Industries

Dashboard design depends on the industry, the operational task, and the speed of response required. An energy control room needs SCADA visibility and outage awareness. A transportation center relies on maps, routes, and fleet movement. A smart city center may combine traffic, utilities, public safety, and municipal services in one shared view.

The core principle is the same across industries: dashboards must turn complex data into a clear operational picture.
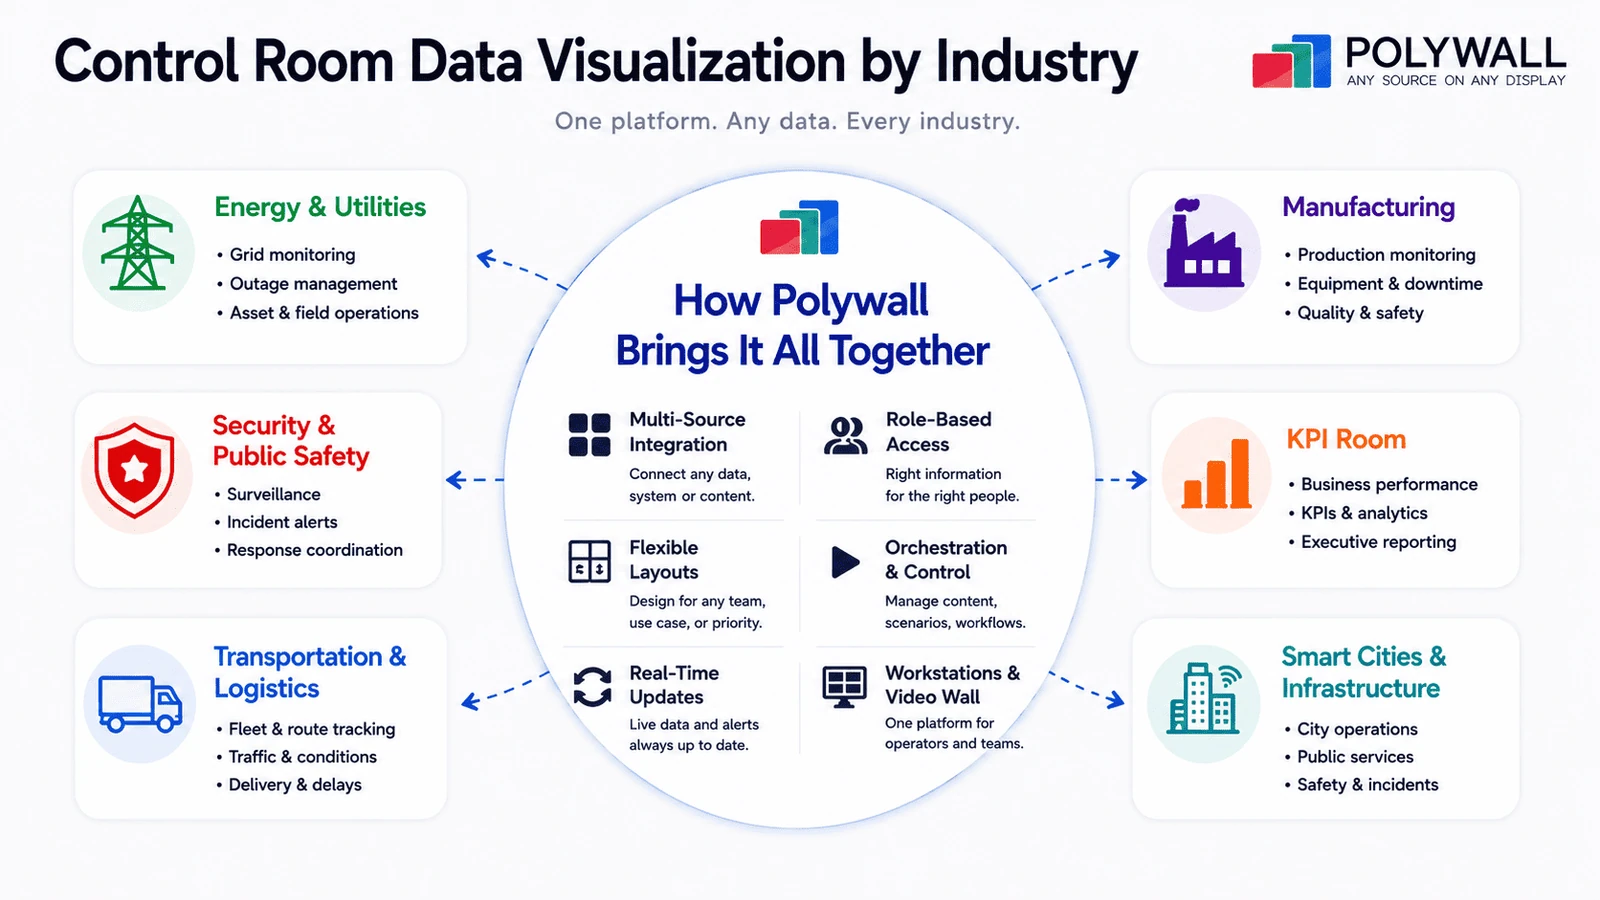
Data visualization examples for control rooms in energy, security, transportation, manufacturing, and smart city environments
Different industries use different data sources and dashboard structures, but all require clear visualization, flexible layouts, and fast access to operational context
IndustryPurpose of visualizationCommon data sourcesTypical dashboard contentMain users
Energy & UtilitiesMonitor grids, substations, generation assets, outages, and field operationsSCADA, GIS, outage management systems, sensors, weather services, asset management toolsGrid status, load and demand, outage areas, alarms, asset status, field crew locations, restoration progressOperators, dispatchers, supervisors, reliability managers
Security & Public SafetyDetect incidents, monitor facilities, verify alarms, and coordinate responseVMS, CCTV, access control, alarms, GIS, incident tracking, emergency communication toolsLive camera feeds, alerts, access events, perimeter alarms, maps, response team locations, event timelinesSecurity operators, dispatchers, supervisors, public safety teams
Transportation & LogisticsTrack movement, routes, traffic, terminals, fleets, and disruptionsGPS, fleet platforms, GIS, traffic systems, CCTV, logistics software, infrastructure monitoringFleet locations, route status, congestion, delays, vehicle telemetry, terminal status, weather, service interruptionsDispatchers, traffic operators, logistics teams, operations managers
ManufacturingMonitor production, equipment status, quality, safety, and downtimeSCADA, MES, ERP, IIoT sensors, quality systems, maintenance toolsProduction KPIs, line performance, equipment alarms, downtime, defect rates, energy use, maintenance alertsPlant operators, production supervisors, engineers, quality teams
City Infrastructure / Smart CitiesCoordinate urban services, traffic, utilities, public safety, and municipal operationsGIS, IoT sensors, traffic systems, CCTV/VMS, utility platforms, emergency systems, public transport dataTraffic flow, public transport status, utility alerts, CCTV feeds, weather, air quality, emergency incidents, service requestsCity operators, traffic managers, utility teams, emergency managers
Across industries, dashboard priorities differ: energy teams need SCADA visibility and alarms, security teams combine live video with incident context, transportation teams rely on maps and fleet data, manufacturing teams monitor production KPIs, and smart city centers combine many municipal systems.

In every case, teams need flexible layouts that bring dashboards, maps, video, documents, tickers, applications, and operational systems into one clear visual environment.

How to Choose the Right Control Room Dashboard Solution

Choosing a control room dashboard solution is not only about displaying dashboards on a large screen. The right platform should help teams manage multiple sources, organize video wall layouts, simplify operator workflows, and keep critical information visible in real time.

When evaluating software for managing dashboards on video walls, focus on the following criteria.

  • Scalability. The system should support new displays, operators, dashboards, workstations, and data sources as the control room grows. This is important when teams regularly add new BI dashboards, monitoring tools, camera feeds, or external sources.
  • Real-time data integration. The solution should display live data from multiple systems without delays. NOCs, SOCs, and EOCs often need to combine dashboards, alerts, maps, video feeds, and incident data in one operational view.
  • Multi-display and video wall support. The platform should be designed for video walls, not only for desktop screens. It should support large display surfaces, saved layouts, source positioning, and fast switching between visualization modes.
  • User interface and ease of use. Operators should be able to manage sources, layouts, and video wall content without complex technical steps. A clear interface reduces training time and helps teams react faster during incidents.
  • Authorization and profile management. Many dashboards require separate logins, roles, and session handling. A good solution should reduce repetitive authentication, support role-based access, and help restore saved layouts or dashboard states.
  • Remote access capability. Control rooms often involve remote supervisors, managers, external experts, and distributed teams. Secure remote access allows users to view and interact with video wall dashboards even when they are not in the room.
  • Integration capabilities. The platform should work with existing systems such as BI tools, SCADA, SIEM, CCTV/VMS, GIS, IT monitoring, tickers, documents, web dashboards, and enterprise applications. A software-based approach makes it easier to add new sources through the network instead of physically reconfiguring the video wall.

By considering these criteria, organizations can choose a control room dashboard solution that improves situational awareness and simplifies the management of complex video wall environments. Polywall supports this approach by helping teams organize dashboards, applications, maps, and live feeds into clear and manageable video wall layouts.

Manage Control Room Dashboards Seamlessly with Polywall

Control room dashboards help teams turn complex operational data into clear, actionable information. But their real value depends on how well they are displayed, organized, and managed across video walls and operator workstations.

Polywall provides a flexible software layer for multi-source visualization. It helps control rooms combine BI dashboards, SCADA views, CCTV feeds, GIS maps, monitoring tools, documents, and enterprise applications in one manageable environment. Teams can create layouts, switch between operational scenarios, interact with content remotely, and maintain a shared real-time picture during daily monitoring or critical incidents.

This makes Polywall a strong choice for NOCs, SOCs, EOCs, command centers, KPI rooms, and other mission-critical environments.

Experience Polywall for yourself: after a demo session with our consultant, receive a fully functional 30-day license of Polywall for free. Optimize your control room workflows and make informed decisions faster.
Planning Your Control Room Project?
Get Free Consultation from Experts
Get a full overview of Polywall’s key functionality.
Demonstrate experience of the control room staff.
Show content management examples.
Create and manage several software sources – dashboards, remote workstation sharing, etc.
Investigate NDI camera workflow.
Check real cases and project diagrams.
Demo
After the demo session with our consultant, you will receive a fully-functional 30-days license of Polywall for free.

Read More

The cookie settings on this website are set to 'allow all cookies' to give you the best experience. Please click on Accept Cookies to continue to use the website.
Accept Cookies